Week of 06/04/22 - 06/10/22
- Jun 21, 2022
- 6 min read
Updated: Jul 5, 2022
This week the group focused on:
Troubleshooting the code for the number display
Test Trials for YL-83 Rain Sensor and Wind Sensor
Completing the wiring setup for the speed limit sign
Group
Wiring the Speed Limit Sign
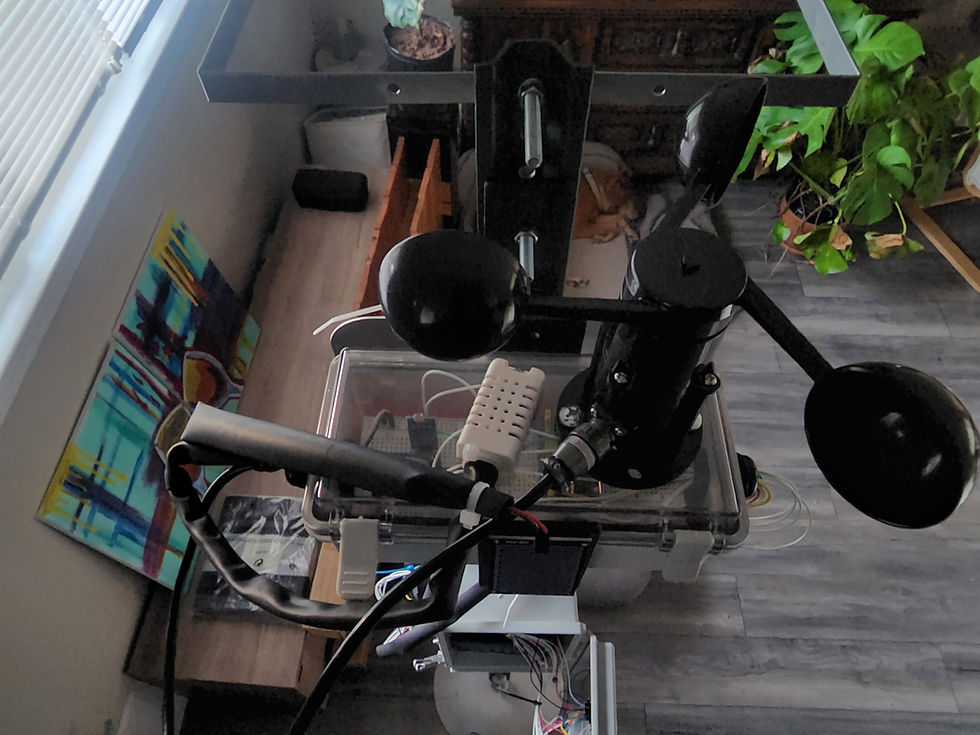
Wiring the speed limit to allow the wires to run through the atmospheric enclosure (Below). In the Atmospheric Enclosure, wires needed to run out of the enclosure (The Anemometer, Temp Sensor and Rain Sensor) was wired out of the enclosure.

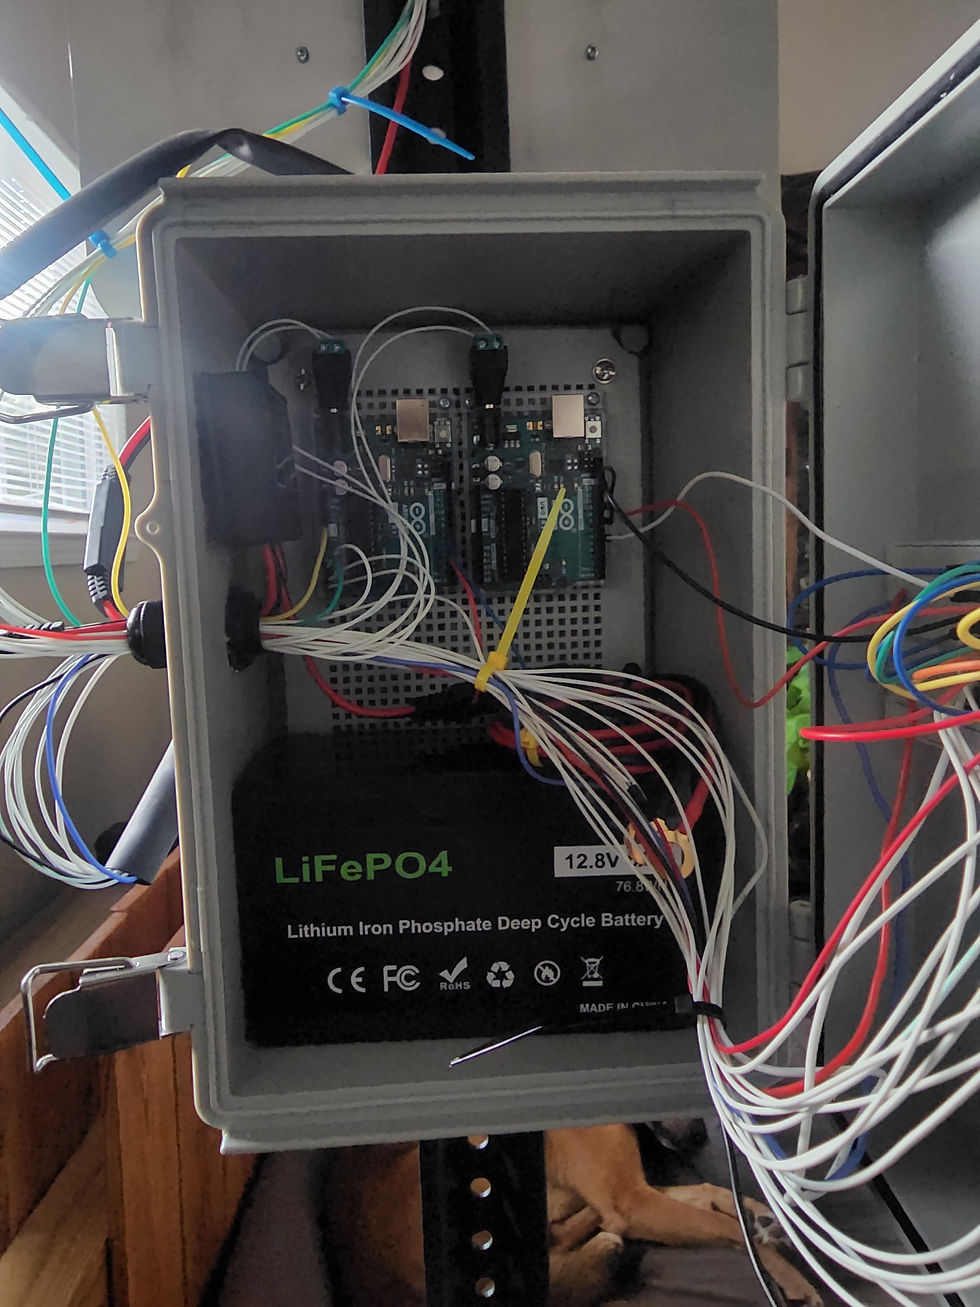
Also, the wiring was routed to the Main Enclosure (Below). The layout remained similar the proposed layout. The main change was the adhering of the solar controller to the body of the enclosure (Left).

Jeremy
YL-83 Rain Sensor Test Trials
We began the test trials for the YL-83 rain sensor. we focused on working on the code to implement the rain sensor. Due to the fact that it is an inverse relationship between reading rain droplets and the voltage on the rain sensor, we were able to determine that the threshold the code would read is when the rain sensor voltage was below 500 millivolts. Our focus was to capture two instances where the sensor could determine light rain shower and heavy rain shower. In addition, we wanted to have a delay of 10 minutes before sending a signal to the system that there is rainfall to filter out sporadic rain showers.
We ran into difficulty when coding the rain sensor. Since the Arduino doesn't contain an internal timer module, we ran into trouble trying to add a delay while also reading the rain sensor output voltage. This would allow the system to determine whether it's heavy rain or light rain. Our work-around this problem was to add a while loop, invested for loop and a nested if loop. The while loop will read once the sensor has crossed below the threshold. This will activate the nested for loop which will be running beyond the 10-minute mark desired and the nested if loop will run a continue function or “block” the time until 600,000 milliseconds have passed. After that, it will then determine which range the YL-83 rain sensor output voltage lands and give the variable “rainType” the value of one or two, where the value one depicts light rain and the value two depicts heavy rain. below is the constructed code
//-------------------
// Beginning of Code
//-------------------
const int rain = A2; // Rain Sensor connected to the pin A2
void setup() {
// sets the function of the pin
pinMode (rain, INPUT); // sets the pin A2 as input
Serial.begin(9600);
delay(10000);
}
void loop() {
// Initalized the analog input
int rainVal = analogRead (rain);
// Initalized the variables for rain sensor
int rainType = 0;
//The "if" condition for rainType (rainType 1 is light rain and rainType 2 is heavy rain)
while (rainVal < 500) {
for (int x = 0; x <= 1000000; x ++) {
if (x <= 600000) {
/* Creates a break in for there to be 10 mins before signaling the system.
Allows for constant rainfall */
continue;
}
if (rainVal < 200){
rainType == 2;
} else {
rainType == 1;
}
}
}
Serial.print("The Rain Sense Voltage in mV is "); Serial.print(rainVal);
// Nested if_else statement to differentiate heavy and light rainfall
while (masterVal = 1) {
if (rainType = 2){
Serial.print("The System is experiencing Heavy Rainfall \n");
} else if (rainType = 1){
Serial.print("The System is experiencing Light Rainfall \n");
} else {
continue;
}
}
The 2 videos below show the light rain with light contact and heavy rain with direct contact simulation, respectively
Below is a table constructed for the trial simulation of the rain sensor in two methods. The first method is for light rain and light contact. This is to simulate a drizzle or a light shower that can occur and the values associated with that. The other method is heavy rain shower and direct contact. This is to simulate more severe rainfall.

Wind Sensor Test Trials
I began running trials on the wind, simulation the wind speed to reach the appropriate threshold. Based on our research, road conditions become affected by the wind when they are approaching 20 mph and above, thus the threshold we aim to reach is 20 mph. Per the datasheet of the 1733 anemometer below, the range of the anemometer can detect up to 70 meters per second.
The conversion of meters per second into the English “miles per hour” is seen below and conversion used to match our 20 mph to the meters per second standard on the

Through calculations from the above equation, to reach our threshold of 20 mph, the wind vine would need to be able to detect 8.94 meters per second. Because the output range for the anemometer is 0.4 V for 0 m/s through 2V for 32 m/s, the sensed output voltage needs to be 0.56 V.

Arduino will require code for an AD converter that will allow the Arduino to read the analog values. The conversion is determined by the number of bits the Arduino can read and the input voltage. The parameters for these cases are in the input voltage being 5 Volts and the Arduino reading up to 10 bit, which converted is 2^10- 1 (due to the fact that is counts 0) = 1023. All of that considered, the following code was used to run the test trails for the anemometer, followed by demo. Per the success criteria, the anemometer tested 10 of 10 times in out test trials
//-------------------
// Beginning of Code
//-------------------
const int wind = A0; // Wind Sensor connected to the pin A0
void setup() {
// sets the function of the pin
pinMode (wind, INPUT); // sets the pin A0 as input
}
void loop() {
// Initalized the analog inputs
int windVal = analogRead (wind);
// Convert analog inputs to read voltages
windVolt = windVal * 5.0 / 1023; // Converting input value to voltage
Serial.print("The Wind Voltage is "); Serial.print(windVolt); Serial.print("\n");
}
Destany
7-Segment Display
The two 7-segment numbers for the Roadway Monitoring System are used to display the current speed to the drivers. The number displays are mainly controlled by the main Arduino, which is the microcontroller that is controlling what the numbers are displaying. The Secondary Arduino also plays a factor in the displaying of the numbers by sending the sensors information to the main Arduino to know what to display. The two 7-segment displays are mounted onto the speed limit sign parallel to each other so when both numbers are lit, it looks like a double digit. As shown in fig. [], the number displays are placed in position to look like the original speed limit sign.
Testing the 7 segment displays:

Below is the continuation of the diagram of the wiring. This specifically shows how it is wired into the Arduino.

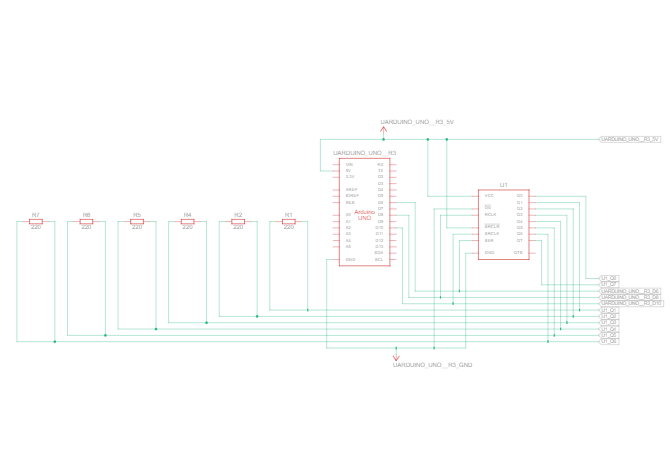
Below is a better look of the system looks inside the waterproof housing. Each display is wired directly to the breadboard where it meets a 220-ohm resistor. From the resistor, it is then connected into the shift register. The outline for the shift registers inputs can be found in fig []. The output of the shift registers is then wired to digital pins 6, 8, and 10. The pins are used to control the outputs of the numbers.

This schematic displays the pin diagram for the shift registers. Each display is wired to a resistor then into the shift register. The numbers are connected to pins Q0 – Q7. These pins are used to turn the different sections of the number display on and off which is what makes the display show what we interpret as a number. The DS pin is connected to D6 of the Arduino, ST_CP pin is connected to D8 of the Arduino and SH_CP is connected to D10 of the Arduino. D6, D8, and D10 work together to change the numbers when the conditions have been triggered. Each of the shift registers as well as the Arduino are connected to Vcc and ground.

The seven segment display

When wiring the 7-segment display, there were some issued with getting the numbers to light up like they should. The back of the displays have flat connections that require the wires that are being led to the shift registers to be soldered onto the numbers. When viewing the schematics for the outputs of the number displays, there is Vcc but no grounding connection. When the 7-segments display were initial connected, there was no grounding connected from the displays to the breadboard. When troubleshooting this, I ran a ground to each of the resistors that were being connected to the shift register. This fixed the lighting issue that was occurring as well as brightened the display by 3x.

This is the lights after connection issue was resolved. Both lights working in unison as well as 3x brighter.


Comments